
School Academic Performance
We are incredibly proud of the academic attainment and progress of all our children here at Dalestorth. A lot of hard work by all members of the school community ensures that children at Dalestorth do the best that they can and achieve well not only in the National Assessment points of their education, but every day, week, month and year.
Here at Dalestorth we are clear about what the children need to learn, we plan carefully ensuring learning is wrapped up in exciting, engaging lessons with a relevant context. We ensure there is a good balance between acquiring knowledge and facts and skills that are transferable to other life situations. Finding the correct pitch, level of difficulty that has just the right amount of challenge, careful scaffolding and modelling in lessons is very important to all of us to ensure all our groups of learners make progress. We make clear to the children how they are doing, what they can do well, what they need to do next and how to get there!
A strength of the school is how well we all know all the children and everyone is kept a very close eye on. This ensures gaps are less likely to appear in either groups of children or individuals. Anyone that is in danger of slipping behind is picked up incredibly quickly and our success rate of 'catch-up' and interventions is excellent.
Our children rise to the challenge of high expectations. They are enthusiastic to learning, take a pride in their work and want to do their best.
Early Years Foundation Stage
| Statistic | 2022-2023 | 2023-2024 | 2024-2025 | 2025-2026 | |||||
|---|---|---|---|---|---|---|---|---|---|
| School | National | School | National | School | National | Cohort | School | National | |
| % achieving a Good Level of Development | 59% | 67% | 53% | 68% | 67% | 68% | 45 | 82% | ~ 72% |
| % at the expected level across all early learning goals | 59% | 66% | 53% | 66% | 67% | 67% | 45 | 82% | ~ 71% |
| Average number of early learning goals at the expected level per pupil | 13.1 | 14.1 | 12.9 | 14.1 | 13.9 | 14.1 | 45 | 14.5 | ~ 14.5 |
Phonics Screening Check
| Statistic | 2022-2023 | 2023-2024 | 2024-2025 | 2025-2026 | |||||
|---|---|---|---|---|---|---|---|---|---|
| School | National | School | National | School | National | Cohort | School | National | |
| % passing in Year 1 | 68% | 79% | 82% | 80% | 66% | 80% | 43 | 84% | ~ 82% |
| % passing check by end of Year 2 | 80% | 89% | 86% | 89% | 91% | 89% | 42 | 81% | ~ 91% |
Key Stage 1
| Subject | Statistic | 2023-2024 | 2024-2025 | 2025-2026 | ||||||
|---|---|---|---|---|---|---|---|---|---|---|
| School | National | School | National | School | National | Cohort | School | National | ||
| Reading, Writing & Maths combined | % achieving the expected standard | 53% | ~ 56% | 48% | ~ 58% | 48% | ~ 59% | 43 | 63% | ~ 58% |
| Reading, Writing & Maths combined | % working at greater depth | 12% | ~ 6% | 9% | ~ 6% | 9% | ~ 6% | 43 | 5% | ~ 6% |
| Reading | % achieving the expected standard | 67% | 68% | 66% | ~ 71% | 64% | ~ 71% | 43 | 65% | ~ 70% |
| Reading | % working at greater depth | 23% | 19% | 23% | ~ 19% | 18% | ~ 19% | 43 | 14% | ~ 18% |
| Writing | % achieving the expected standard | 60% | 60% | 52% | ~ 62% | 61% | ~ 64% | 43 | 65% | ~ 63% |
| Writing | % working at greater depth | 19% | 8% | 11% | ~ 8% | 9% | ~ 9% | 43 | 9% | ~ 9% |
| Maths | % achieving the expected standard | 72% | 70% | 64% | ~ 72% | 66% | ~ 73% | 43 | 67% | ~ 71% |
| Maths | % working at greater depth | 19% | 16% | 16% | ~ 16% | 23% | ~ 16% | 43 | 9% | ~ 15% |
| Science | % achieving the expected standard | 95% | 79% | 84% | ~ 82% | 86% | ~ 83% | 43 | 77% | ~ 83% |
Year 4 Multiplication Tables Check (MTC)
| Statistic | 2022-2023 | 2023-2024 | 2024-2025 | 2025-2026 | |||||
|---|---|---|---|---|---|---|---|---|---|
| School | National | School | National | School | National | Cohort | School | National | |
| % scoring full marks (25/25) | 22% | 29% | 14% | 34% | 16% | 37% | 48 | 10% | ~ 44% |
| Average score (out of 25) | 18.7 | 20.2 | 18.1 | 20.6 | 18.0 | 21.0 | 47 | 17.7 | ~ 21.6 |
Key Results - 2025-2026
| Assessment | Statistic | Cohort | School Result | National Comparison | National Result | School Percentile Rank |
|---|---|---|---|---|---|---|
| KS2 Reading, Writing & Maths combined | % achieving the expected standard | 44 | 45% | Below (significant) | 63% | 12th |
| KS2 Reading, Writing & Maths combined | % achieving the higher standard | 44 | 5% | Below | ~ 8% | 38th |
| Subject | Statistic | 2022-2023 | 2023-2024 | 2024-2025 | 2025-2026 | |||||
|---|---|---|---|---|---|---|---|---|---|---|
| School | National | School | National | School | National | Cohort | School | National | ||
| Reading, Writing & Maths combined | % achieving the expected standard | 56% | 60% | 64% | 61% | 43% | 62% | 44 | 45% | 63% |
| Reading, Writing & Maths combined | % achieving the higher standard | 11% | 8% | 11% | 8% | 5% | 8% | 44 | 5% | ~ 8% |
| Reading | % achieving the expected standard | 69% | 73% | 78% | 74% | 55% | 75% | 44 | 66% | 75% |
| Reading | % achieving the higher standard | 22% | 29% | 16% | 29% | 18% | 33% | 44 | 16% | ~ 30% |
| Reading | Average scaled score | 104.3 | 105.0 | 103.5 | 105.0 | 100.7 | 106.0 | 43 | 102.2 | 106.0 |
| Writing | % achieving the expected standard | 76% | 71% | 73% | 72% | 61% | 72% | 44 | 59% | 73% |
| Writing | % working at greater depth | 22% | 13% | 20% | 13% | 9% | 13% | 44 | 11% | ~ 13% |
| Maths | % achieving the expected standard | 71% | 73% | 76% | 73% | 59% | 74% | 44 | 70% | 75% |
| Maths | % achieving the higher standard | 22% | 24% | 33% | 24% | 18% | 26% | 44 | 11% | ~ 27% |
| Maths | Average scaled score | 104.5 | 104.0 | 105.0 | 104.0 | 101.8 | 105.0 | 43 | 101.6 | 105.0 |
| GPS | % achieving the expected standard | 73% | 72% | 80% | 72% | 68% | 73% | 44 | 70% | 74% |
| GPS | % achieving the higher standard | 36% | 30% | 29% | 32% | 23% | 30% | 44 | 18% | ~ 30% |
| GPS | Average scaled score | 105.5 | 105.0 | 105.5 | 105.0 | 102.6 | 105.0 | 43 | 103.1 | 105.0 |
| Science | % achieving the expected standard | 91% | 80% | 91% | 81% | 84% | 82% | 44 | 84% | 82% |
Progress
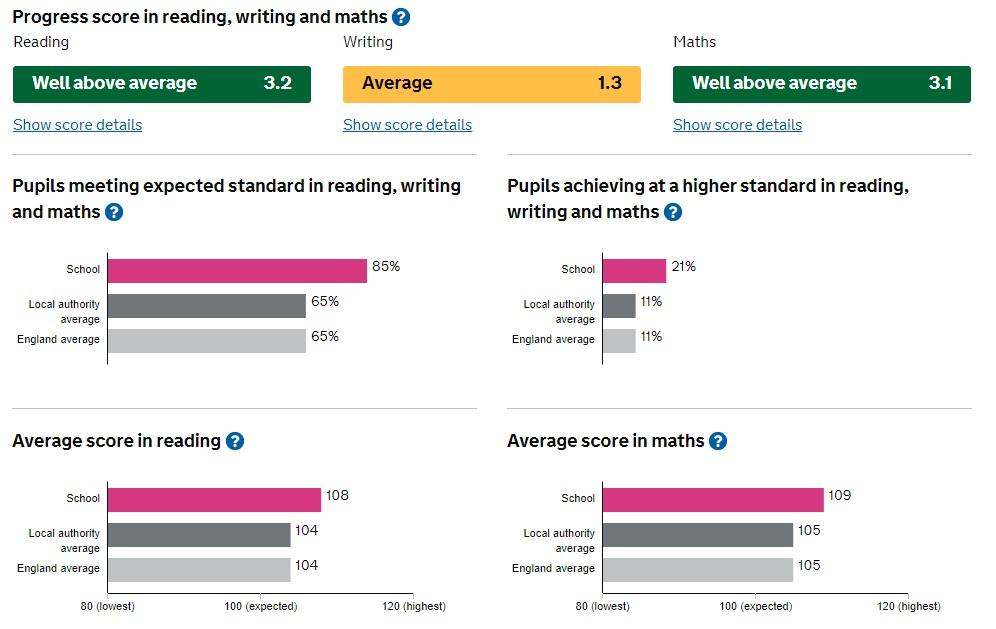
In addition to having to have Attainment in line/better than National, schools are also measured and held accountable for what progress children make as they pass through school from Key Stage 1 to the end of Key Stage 2.
The new measures for progress means that if a school holds a progress score of 0, then that is in line with National. If a school has any negative - progress scores it means the children have not performed as well as they could have done and not made sufficient or expected progress. If a school has positive + progress scores it means that the children have made more than sufficient or expected progress. You can see our progress scores below for 2021-22 and 2022-23. Our children made progress in line with other children or above other children nationally.
2021-22
Reading = +0.2
Writing = +1.1
Maths = -0.38
2022-23
Reading = 0
Writing = +2.0
Maths = +1.1
2023-24
There are no progress scores available this year as this cohort did not take part in year 2 SATs due to Covid.
KS2 Results 2018-2019
The government will not publish KS2 school level data for the 2021 to 2022 academic year. The last available public data is from the 2018 to 2019 academic year. It is important to note that the data from that year may no longer reflect current performance.
Compare Schools
Every year the Department for Education publishes information on the achievement and attainment of pupils in all schools. These tables provide a guide to how well a school is doing. They list National Curriculum test results for each school in England and show how they compare with other schools.
As well as our own schools performance results you are able to access information on all schools throughout England so that you are able to see how each individual school compares with others, locally, county and nationally and against the average across the country.